Aretas IoT Cloud
The Aretas IoT Cloud Platform is the best end-to-end solution available on the market today. Machine Learning, Forecasting, Advanced Time Series Databases, Alerting & Control, RTLS, Building View and more. Machine Learning algorithms learn patterns in your data and can recognize custom events and trends. A complete separation of UI and API allows developers to write their own Front End or use the API independently. Post your own custom data or purchase one of the hundreds of sensor combinations Aretas produces. The Aretas IoT Cloud Platform has been around for almost 10 years and has undergone many transformations. We have learned from nearly a decade of experience in this business.
Main Map View
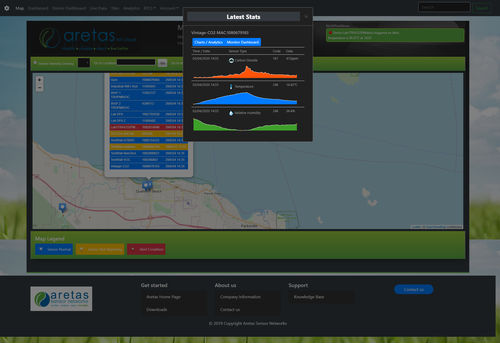
View all of your locations from one central map. Click on each map pin to view all of the sensors in that location. Click on each sensor to view the latest statistics. Click to go to the full sensor charting. Instantly view areas of concern as pins change color based on statuses of Strategies or Alerts.
Building View
Building View allows you to attach building schematics, floor plans or other maps to a Location. This tab within the map view allows you to see where your sensors have been placed within your facility. Within the building view you can easily see when to turn on a ventilation or HVAC system, when to activate filtration such as Ozone treatment for cigarette smoke and much more
Sensor Intensity Maps
View sensor intensity maps by sensor type, which allow you to easily identify areas where gas concentrations are higher, temperatures are higher (or lower), noise is louder, or where more dust is accumulating.


