Visualization software module PI Vision™programmingmonitoringreporting

Add to favorites
Compare this product
Characteristics
- Function
- analysis, interface, reporting, visualization, monitoring, dashboard, sharing, programming, creation
- Applications
- industrial, process, color
- Type
- real-time
- Operating system
- Windows
- Deployment mode
- web-based
Description
The fastest, easiest way to visualize AVEVA™ PI Server™ data
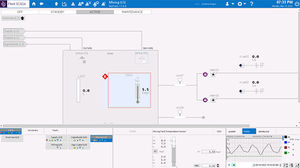
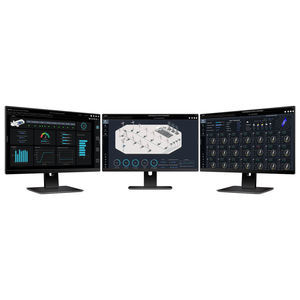
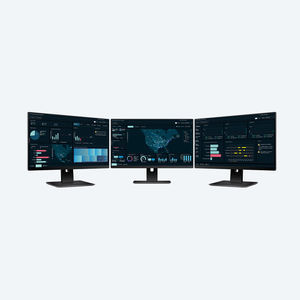
AVEVA PI Vision is a web-based display and dashboard building tool. Users can easily build configurable visualizations of their real-time operations data without programming or domain knowledge.
“We have a customer response center that is manned 24 hours per day. They have (PI Vision) screens up in their command center around the clock. They can actually see what is going on around campus. Before, it was getting a call from the end user and that’s not really how it is supposed to work.”
Benefits
Enable immediate problem-solving
Explore complex data seamlessly with an intuitive interface, dynamic displays, and easy display navigation.
Gain instant self-service access
Get rapid insights with instant data access, drag-and-drop display creation, and on-the-go mobility.
Create consistent views
Streamline information access with rapid deployment and roll-out, display organization, and consolidated information in reduced displays
Features
Real-time operational visibility
Access critical data visualizations and dashboards anytime, anywhere on any device or supported browser for on-the-go operational awareness.
Real-time process alerts
Turn data into action with real-time visual alarms. Symbols change color, blink, or transform to instantly highlight process issues, allowing operators to react faster and avoid downtime.
Drag-and-drop display creation
Build custom dashboards with color-coded symbols, shapes and gauges that instantly convey equipment health, to help prioritize and respond to critical situations.
VIDEO
Catalogs
AVEVA™ Predictive Analytics
6 Pages
Related Searches
- Automation software solution
- Management software solution
- Analysis software solution
- Process software solution
- Windows software solution
- Computer-aided design software
- Control software solution
- Real-time software solution
- Online software
- Design software solution
- 3D software solution
- Monitoring software solution
- Interface software
- Measurement software
- Industrial software solution
- Quality software
- Simulation software
- Visualization software solution
- Programming software
- Automated software
*Prices are pre-tax. They exclude delivery charges and customs duties and do not include additional charges for installation or activation options. Prices are indicative only and may vary by country, with changes to the cost of raw materials and exchange rates.


