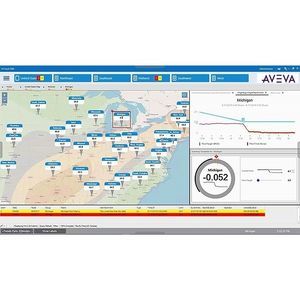
Bring the value of AVEVA Insight’s artificial intelligence engine into the control room. Automatically detect anomalies in your data and present this in a context-aware view for your operations team.
Identify. Investigate. Improve.
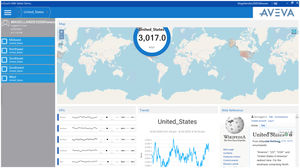
Anomalies detected by AVEVA Insight are presented in a tabular view within OMI, with simple yet powerful sorting, filtering, and searching capabilities to help your operators find what they’re looking for quickly and easily.
Details for each anomaly are displayed in a fold-out side panel showing the asset, a summary of the anomaly, and a chart highlighting when the anomaly occurred which can be opened full-screen for a more in-depth diagnosis.
Anomalies can be classified as either useful or not useful, which is used to help improve the Artificial Intelligence algorithms, so you see more of what’s valuable and less of what isn’t.
Follow OMI Context
Allows operators to identify potential anomalies in their data as they occur, providing an integrated tabular-view of all system anomalies that can be quickly filtered for simple review in conjunction with other system information.
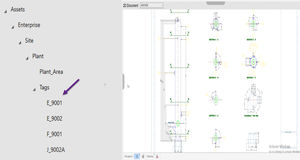
Changes in OMI context will apply filtering within the Insight OMI App such that only stories that match the current OMI asset context are shown.
Drives the current OMI context when a story (anomaly) is selected in the details view, affecting the active context of other OMI content in the same layout.
Your At-a-glance Health Check
In addition to the tabular details view, the Insight OMI App also includes a summary view, providing you a heads-up display of how many anomalies have been detected across the entire system.