
- Company
- Products
- Catalogs
- News & Trends
- Exhibitions
Digital filter software shock response spectrum (SRS)processmechanical
Add to favorites
Compare this product
Characteristics
- Function
- digital filter, shock response spectrum (SRS)
- Applications
- process, mechanical
- Type
- real-time, 2D
Description
Shock Response Spectrum Analysis
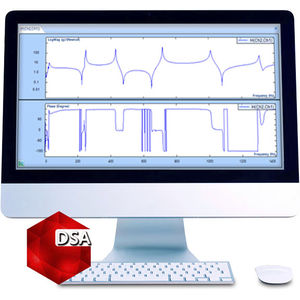
A Shock Response Spectrum (SRS) is a graphical presentation of a transient acceleration pulse’s potential to damage a structure. It plots the peak acceleration responses of a bank of single degree-of-freedom (SDOF) spring, mass damper systems all experiencing the same base-excitation as if on a rigid massless base. Each SDOF system has a different natural frequency; they all have the same viscous damping factor. A spectrum results from plotting the peak accelerations (vertically) against the natural frequencies (horizontally). An SRS is generated from a shock waveform using the following process:
Specify a damping ratio for the SRS (5% is most common)
Use a digital filter to model an SDOF of frequency, fn and damping ξ.
Apply the transient as an input and calculate the response acceleration waveform.
Retain the peak positive and negative responses occurring during the pulse’s duration and afterward.
Select one of these extreme values and plot it as the spectrum amplitude at fn.
Repeat these steps for each (logarithmically spaced) fn desired.
The resulting plot of peak acceleration vs. spring-mass-damper system natural frequency is called a Shock Response Spectrum, or SRS.
An SDOF mechanical system consists of the following components:
Mass, M
Spring, K
Damper, C
The natural frequency, Fn, and the critical damping factor, ξ , characterize a SDOF system, can be calculated from above parameters.
Catalogs
No catalogs are available for this product.
See all of CRYSTAL INSTRUMENTS‘s catalogsRelated Searches
- Automation software solution
- Management software solution
- Analysis software solution
- Process software solution
- Windows software solution
- Computer-aided design software
- Control software solution
- Online software
- Real-time software solution
- Design software solution
- 3D software solution
- Monitoring software solution
- Measurement software
- Interface software
- Industrial software solution
- Quality software
- Visualization software solution
- Automated software
- Network software solution
- Machine software
*Prices are pre-tax. They exclude delivery charges and customs duties and do not include additional charges for installation or activation options. Prices are indicative only and may vary by country, with changes to the cost of raw materials and exchange rates.


