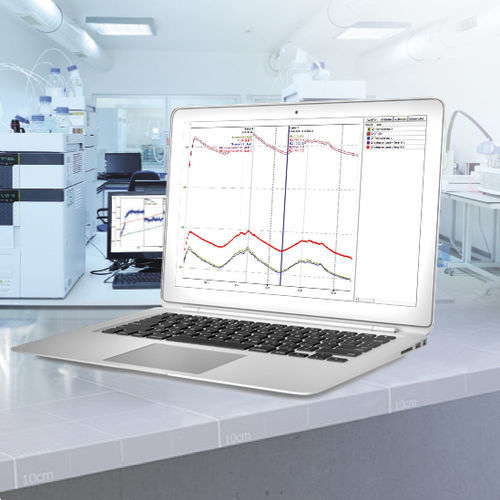
With ProfiSignal Go you can display online data in diagram form. Numerous analysis functions, such as zoom, cursor, movable axes, flags, ASCII export and calculation channels, enable fast display of measured values and post-processing.
Data acquisition and analysis with ProfiSignal Go
With the ProfiSignal Go software, you can start acquiring and evaluating your measurement data without long preparation. A wide range of functions are available to help you solve your measurement problems.
The principle of the ProfiSignal Go data acquisition software is based on any number of online analyses, whereby each online analysis can be assigned a diagram with any number of selectable channels. You can assign a trend diagram (y(t) diagram), a characteristic curve diagram (y(x) diagram) or a logic diagram to the individual online analyses.
ProfiSignal Go has an online and an offline mode. With the online mode, you can observe the current events of your processes. With the offline mode you can access historical data, also in high resolution. You can move back and forth on the timeline.
The statistics as well as the on- and offline calculation functions round off the range of functions of ProfiSignal Go and facilitate the evaluation of your measurements.
Product highlights
Users can monitor and evaluate processes both online and offline
Various diagram types for data visualisation (online/offline)
Seamless switching to the offline area
ASCII export as CSV file / trend export as vector-based EMF file
Statistics and offline calculation functions
Analysis with cursor functions down to the μs
Evaluation of digital signal sequences


