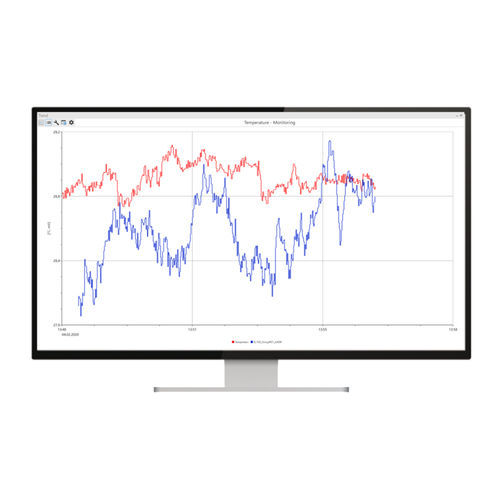
With ProfiSignal 20 Go you can start collecting and analysing your measurement data without long lead times.
Fast project planning and analysis of measurement data
With ProfiSignal 20 Go you can visualise your measurement data in just a few steps, both online and offline, in various diagram types, monitor, analyse, archive as a measurement file or export directly in the appropriate file format.
Already during the ongoing measurement, you can also access historical measured values without interruption, for example, to compare them with the current test. With the help of various statistics functions, data areas to be examined can be marked and analysed directly.
Product highlights
Multi-track diagrams for linking several measurement curves with the same time axis, e.g. for direct comparison of analogue and digital signals
SCACH function - One scan is enough to open the correct diagram
From the measured value to the diagram display with just a few (mouse) clicks
Monitoring and analysis of any measured values from the most diverse sources (hardware and software)
Single and multi-axis y(t) diagrams with the possibility of simultaneous display and analysis of different measured variables
Statistical evaluation and on- and offline calculation functions
Smooth zoom function from the general overview to the high-resolution μsec range
Data export as CSV file, in Diadem or WAV format
Simplified trial execution and batch processes thanks to user-friendly recorder function


