- Robotics - Automation - Industrial IT
- Industrial Software
- Control software
- Delphin Technology AG
Analysis software ProfiSignal 20 Basicmonitoringprogrammingmeasurement
Add to favorites
Compare this product
Characteristics
- Function
- analysis, monitoring, programming, measurement, visualization, for test, control, data acquisition, process control, labeling
- Applications
- process
Description
With ProfiSignal 20 Basic you get a fast and intuitive solution for your monitoring application or your process visualisation.
Monitoring and process control of measurement data
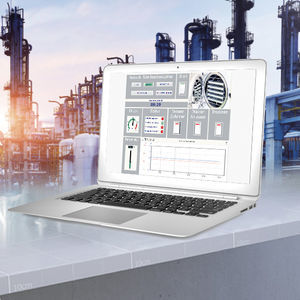
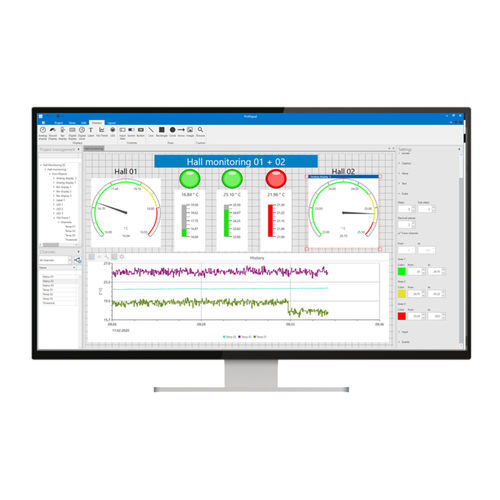
With ProfiSignal 20 Basic you can create individual charts using a wide range of operating and observation elements.
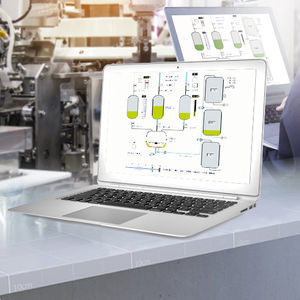
Both continuous processes (e.g. production data acquisition) and discontinuous measurement tasks (e.g. test measurements) can be visualised, operated and monitored without any programming effort. You can create the operating and monitoring diagrams by assembling and configuring the prefabricated elements.
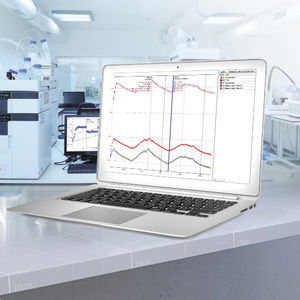
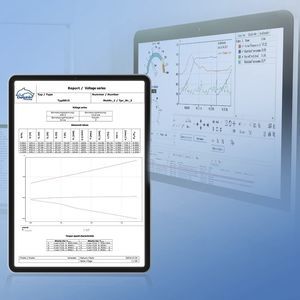
All functions of the ProfiSignal 20 Go software, with the different diagram types as well as analysis and export functions, are completely included in ProfiSignal 20 Basic and round off the functional diversity of your application.
In addition to the visualisation and analysis of measured values, many users need a simple way to monitor and control their processes. Here, the use of ProfiSignal 20 Basic, which in addition to the pure display and analysis of measured values also has functions for process visualisation and control, is of great advantage.
Product highlights
Intuitive creation of charts without programming effort
Ready-made operating and observation elements
Analogue displays, round displays, bar graphs
Digital displays, signal lights
Geometric objects and text fields
All diagram types from the ProfiSignal 20 Go software
Images
Catalogs
No catalogs are available for this product.
See all of Delphin Technology AG‘s catalogsRelated Searches
- Automation software solution
- Management software solution
- Analysis software solution
- Process software solution
- Windows software solution
- Control software solution
- Computer-aided design software
- Online software
- Design software solution
- Monitoring software solution
- Interface software
- Measurement software
- Industrial software solution
- Quality software
- Visualization software solution
- Automated software
- Programming software
- Development software
- Network software solution
- Machine software
*Prices are pre-tax. They exclude delivery charges and customs duties and do not include additional charges for installation or activation options. Prices are indicative only and may vary by country, with changes to the cost of raw materials and exchange rates.


