- Products
- Catalogs
- News & Trends
- Exhibitions
Reporting software for indoor air qualityautomated
Add to favorites
Compare this product
Characteristics
- Function
- reporting
- Applications
- for indoor air quality
- Type
- automated
Description
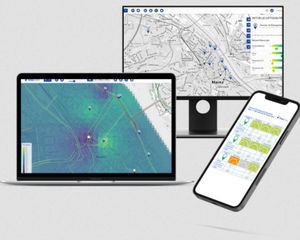
Understand trends, influences and changes of air quality.
Brings transparency and helps enable action
Clear, structured information in an easy-to-read
Various options available with regard to:
level of detail
reporting period
information and
presentation format
FEATURES
Evaluation of O3, NO2, PM2.5, PM10, additional environmental parameters such as temperature, air pressure, humidity and other additional data possible (weather, traffic, etc.)
Efficient, automated compilation of data
Reports are consistent with views in the dashboard
Included as built-in service in bundles; subscription to more detailed reports possible
Various reporting options available
Pollutant readings in tabular format
Reporting period: 1 month
Content: calibrated Sentience data and data from public measuring stations, as available, for the project area
Format: PDF
Display of time-based trends for air quality and weather parameters in graphical format
Reporting period: 1 month
Content:
calibrated Sentience data and data from public measuring stations as available for the project area
weather patterns
Format: HTML (allows user interactivity within the report)
Related Searches
- Automation software solution
- Management software solution
- Analysis software solution
- Control software solution
- Real-time software solution
- Online software
- Monitoring software solution
- Measurement software
- Quality software
- Automated software
- Development software
- Network software solution
- Creation software
- Reporting software solution
- Planning software
- Data acquisition software
- Calibration software
- Dashboard software solution
- Commercial software
*Prices are pre-tax. They exclude delivery charges and customs duties and do not include additional charges for installation or activation options. Prices are indicative only and may vary by country, with changes to the cost of raw materials and exchange rates.


