
- Products
- Catalogs
- News & Trends
- Exhibitions
Visible spectrophotometer V seriessingle-beambenchtop
Add to favorites
Compare this product
Characteristics
- Spectrum
- visible
- Optical design
- single-beam
- Other characteristics
- benchtop
- Wavelength
Min.: 325 nm
Max.: 1,000 nm
Description
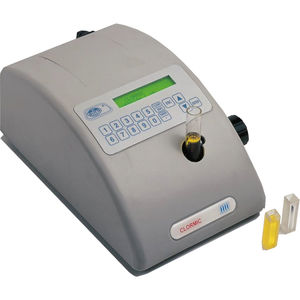
Visible range spectrophotometers “V-1100” and “VR-2000”
“V-1100” MODEL WITH MANUAL WAVELENGTH SETTINGS AND AUTOMATIC BLANK.
“VR-2000” MODEL WITH AUTOMATIC WAVELENGTH SETTINGS AND BLANK.
APPLICATIONS
They are widely used in colleges and enterprises for general quantitatives analysis and experiments based in absorbance measurements.
COMMON FEATURES
High quality silicon photometric diode detector and 1200 lines/mm diffraction grating ensure the high quality accuracy and precision.
Digital display for an easy readout.
Automatic zero and blank (easy to use). Easy switching of transmittance, absorbance and concentration modes, just by pressing one key.
Large sample compartment, which can accommodate 5 to 100mm path length cuvettes with optional holders.
Its pre-aligned design makes it possible to change the halogen lamps by the user himself.
Optional:
Optional software based on Windows® which can expand the applications to standardcCurve and kinetics.
V-1100 MODEL
Easy of use.
Ergonomic and solid design for a continuous suitable use, for students and workers.
VR-2000 MODEL
Large LCD screen (128x64bits).
It can display a total of 50 groups of data (3 groups per screen).
It can display standard curve and kinetics curve graphic.
The system can also save the test results.
A total of 50 data groups and 10 standard curves can be saved in the RAM memory.
At most 9 standard samples can be used to establish a standard curve.
The curve and the curve equation will be displayed simultaneously on the screen.
The unknown concentration solutions, can be measured by the curve.
If one knows the coefficient k and b of the formula: C=kA+b, one can input the value directly.
Related Searches
- Spectrophotometer
- Visible spectrophotometer
- Benchtop spectrophotometer
- PH meter
- UV spectrophotometer
- Digital pH meter
- Portable pH meter
- Conductivity meter
- Color meter
- Photometer
- Absorption spectrophotometer
- Laboratory pH meter
- Digital conductivity meter
- Portable conductivity meter
- Bench-top pH meter
- Single-beam spectrophotometer
- Spectrophotometer for pharmaceutical applications
- Bench-top conductivity meter
- Conductivity meter with LCD display
- Laboratory colorimeter
*Prices are pre-tax. They exclude delivery charges and customs duties and do not include additional charges for installation or activation options. Prices are indicative only and may vary by country, with changes to the cost of raw materials and exchange rates.


