Drive business insights with data intelligence and embedded AI from the leading cloud data and analytics ecosystem.
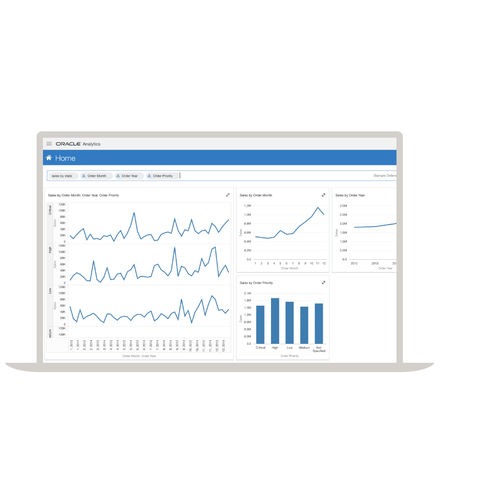
Explore and search data visually or verbally
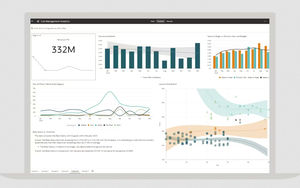
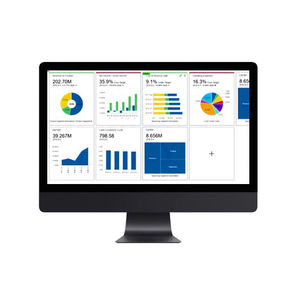
Discover the signals in data and make complex analyses engaging, meaningful, and easy to understand. A code-free drag-and-drop interface enables everyone to build interactive data visualizations without specialized skills.
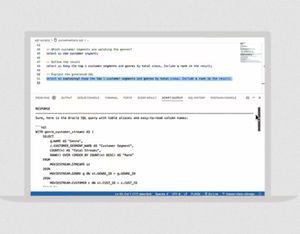
Ask business questions through a simple search-like experience—using text or voice—to obtain spoken narratives of the results, in addition to traditional visualizations and dashboards.
Explainable machine learning
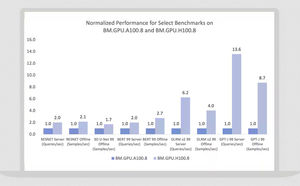
Any user can now see simple explanations of the factors that influenced a machine learning model to predict a certain outcome. In addition, they can interact with a model, adjusting factors to fine-tune the results. For example, of all the factors that influence employees to leave, users can quickly see which were the most determinant and why.
Show data relationships visually
With Graph Analytics it is easy to understand how people and transactions are connected or the shortest distance between two hubs in a network. This has powerful applications in various domains, from marketing and social media to security and compliance. For example, pathfinding lets a user find the shortest path between two points or measure the importance of website pages.