- Robotics - Automation - Industrial IT
- Industrial Software
- Dashboard software
- Solare Datensysteme GmbH
Dashboard software Solar-Log™web-based
Add to favorites
Compare this product
Characteristics
- Function
- dashboard
- Deployment mode
- web-based
Description
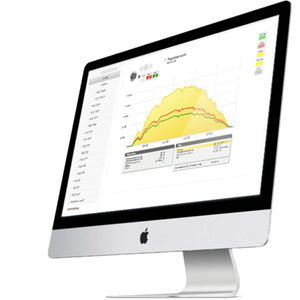
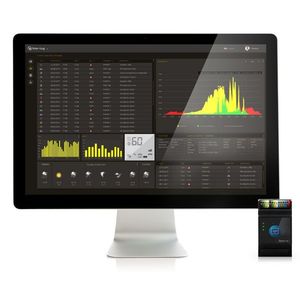
Solar-Log™ Dashboard
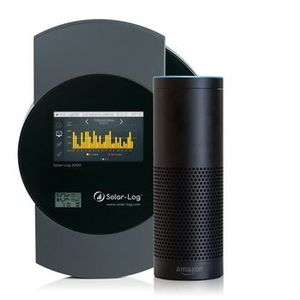
Present your photovoltaic plant's performance data impressively and individually. The Dashboard delivers a concise presentation of yields, CO2 savings and performance. As an alternative, we also recommend large external Solarfox® displays and the app - Solar-Log WEB Enerest™ – for mobile.
With the Solar-Log™ Dashboard, Solar-Log WEB Enerest™ L and XL provides a dynamic display of important plant information such as yields, CO2 savings and performance. The display can be set up by selecting up to any four of the following elements: Current Production, Yield History including self-consumption, Earnings, Weather, Plant Information and Environmental contribution. The Data Overview module makes it possible to even display the total yield data from several plants in one Dashboard. The Image and Text module allows you to add your own content to the Solar-Log™ Dashboard. There is the option to display up to four modules in the full-screen mode or to display the files as a slideshow.
Catalogs
*Prices are pre-tax. They exclude delivery charges and customs duties and do not include additional charges for installation or activation options. Prices are indicative only and may vary by country, with changes to the cost of raw materials and exchange rates.


