- Robotics - Automation - Industrial IT
- Industrial Software
- Visualization software
- TechnoTeam Bildverarbeitung GmbH

- Company
- Products
- Catalogs
- News & Trends
- Exhibitions
Analysis software TechnoTeam 3D Viewervisualization3D
Add to favorites
Compare this product
Characteristics
- Function
- analysis, visualization
- Type
- 3D
Description
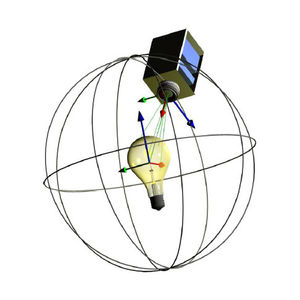
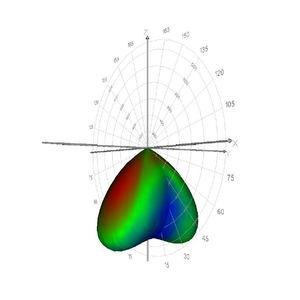
The 3D visualization of luminous intensity distributions using the Techno Team 3D Viewer allows an analysis of the total measured distribution at a glance. LIDs are visualized three-dimensionally from any observer perspective. Photometric instabilities or sporadic disorders of the distribution, which are difficult to identify in the classical polar representation, occur in the 3D representation shows clearly visible. A variety of visualization options allows variable and user customized display as well as a synchronous observer point to the current visual comparison of several LIDs.
Catalogs
LED_checker
2 Pages
Other TechnoTeam Bildverarbeitung GmbH products
GONIOPHOTOMETER
Related Searches
- Analysis software solution
- 3D software solution
- Measurement software
- Visualization software solution
- Automated software
- Embedded software
- Software for automotive applications
- Color software
- Comparison software
- Assessment software
- Display software
- Converter software
- Luminance measurement software
- Photometric analysis software
*Prices are pre-tax. They exclude delivery charges and customs duties and do not include additional charges for installation or activation options. Prices are indicative only and may vary by country, with changes to the cost of raw materials and exchange rates.


