- Metrology - Laboratory
- Inspection and Monitoring
- Agriculture camera
- Workswell s.r.o.

- Company
- Products
- Catalogs
- News & Trends
- Exhibitions
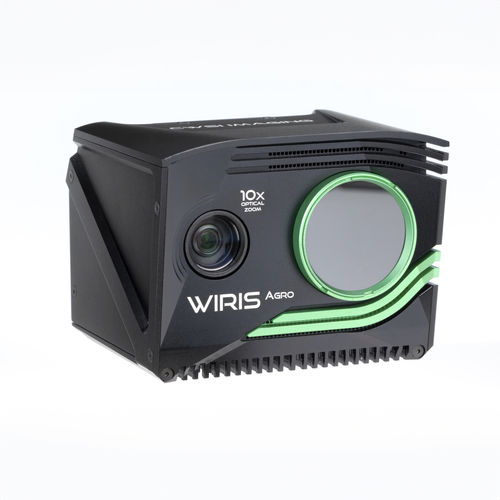
Agriculture camera WIRIS Agro RdigitalthermalLWIR
Add to favorites
Compare this product
Characteristics
- Applications
- agriculture
- Technology
- digital
- Function
- thermal
- Spectrum
- LWIR
- Resolution level
- full HD
Description
The Workswell WIRIS Agro R is the first device of its kind. Designed to map water stress across large areas, the Agro has a critical role to play in the field of precision agriculture. The device facilitates the determination of the water stress value in a given stand of plants. This information can then be used to determine yield maps, optimize irrigation, and fine-tune water management strategies.
CROP DROUGHT
ACTUAL AND REAL VALUE
In the dry season, precision farmers want to measure the actual effect of drought on their crops. However, this can be difficult to identify. For example, crops may respond differently to drought if they have access to groundwater, and each plant has a different root system. These factors make it hard to tell how much a particular crop might be suffering during a given drought. That’s where the WIRIS Agro comes in. This thermal camera makes real-time measurements of the actual effects of drought on a crop.
COLOUR MAP OVERVIEW
The WIRIS Agro R offers four different color maps. In terms of data processing, it is not important which map you choose, but a suitable palette choice can enhance data visualization. Each color map is defined as follows: the palette is black and white as you move away from both the 0 value (negative values below the range), and the 100% value (values above the range).
Catalogs
WIRIS Agro R
4 Pages
Related Searches
- Digital camera module
- CMOS camera module
- Industrial camera system
- Infrared imager
- USB camera module
- Vision processing camera
- Waterproof camera system
- Thermal camera
- Inspection system
- Gigabit Ethernet camera
- Inspection camera system
- Power-over-Ethernet camera
- Machine vision camera module
- Laboratory imager
- Automated inspection system
- AI-based camera
- Full HD camera module
- Ethernet imager
- Measuring camera system
- IP67 imager
*Prices are pre-tax. They exclude delivery charges and customs duties and do not include additional charges for installation or activation options. Prices are indicative only and may vary by country, with changes to the cost of raw materials and exchange rates.


